Fatigue, Failure, and the Data That Brought Me Back
After six weeks of missed training, my PGIS morning check-in revealed what a GPS watch alone never shows: glycemic and autonomic recovery run on entirely different clocks.
Listen to this post
Fatigue, Failure, and the Data That Brought Me Back
On this page7 sections
Six weeks of missed training showed up this morning in a single number.
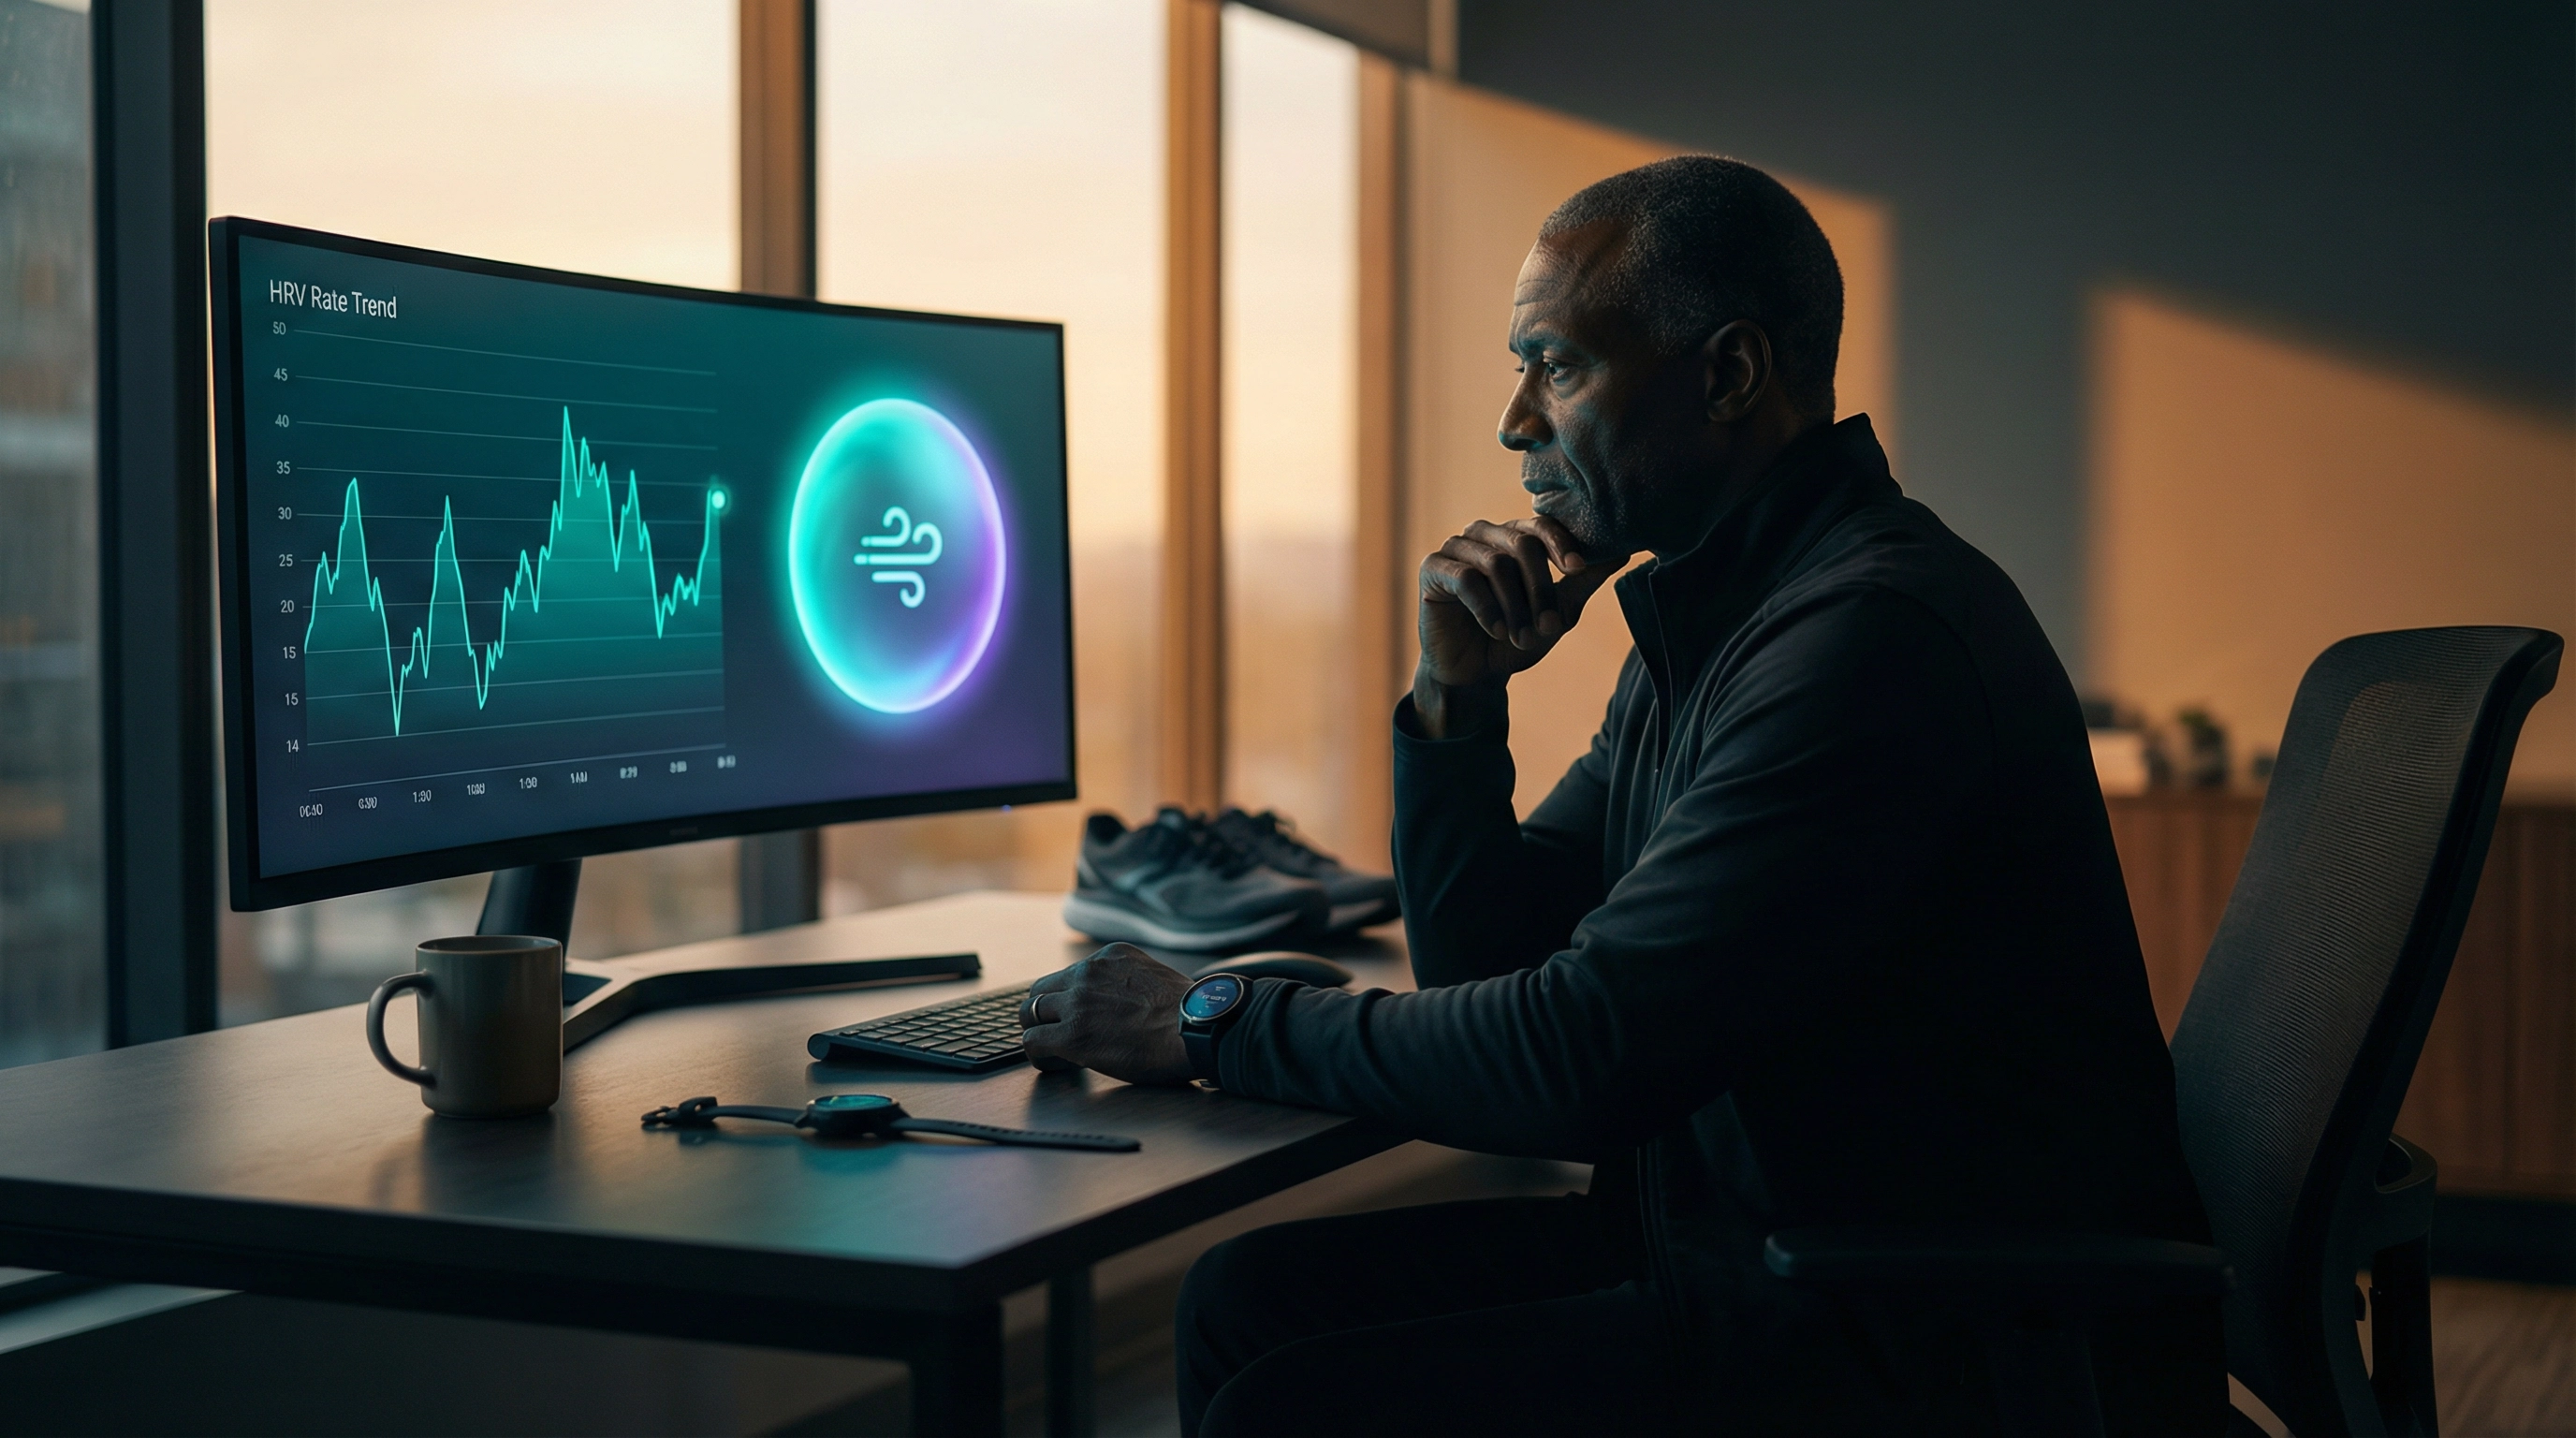
HRV: 22.
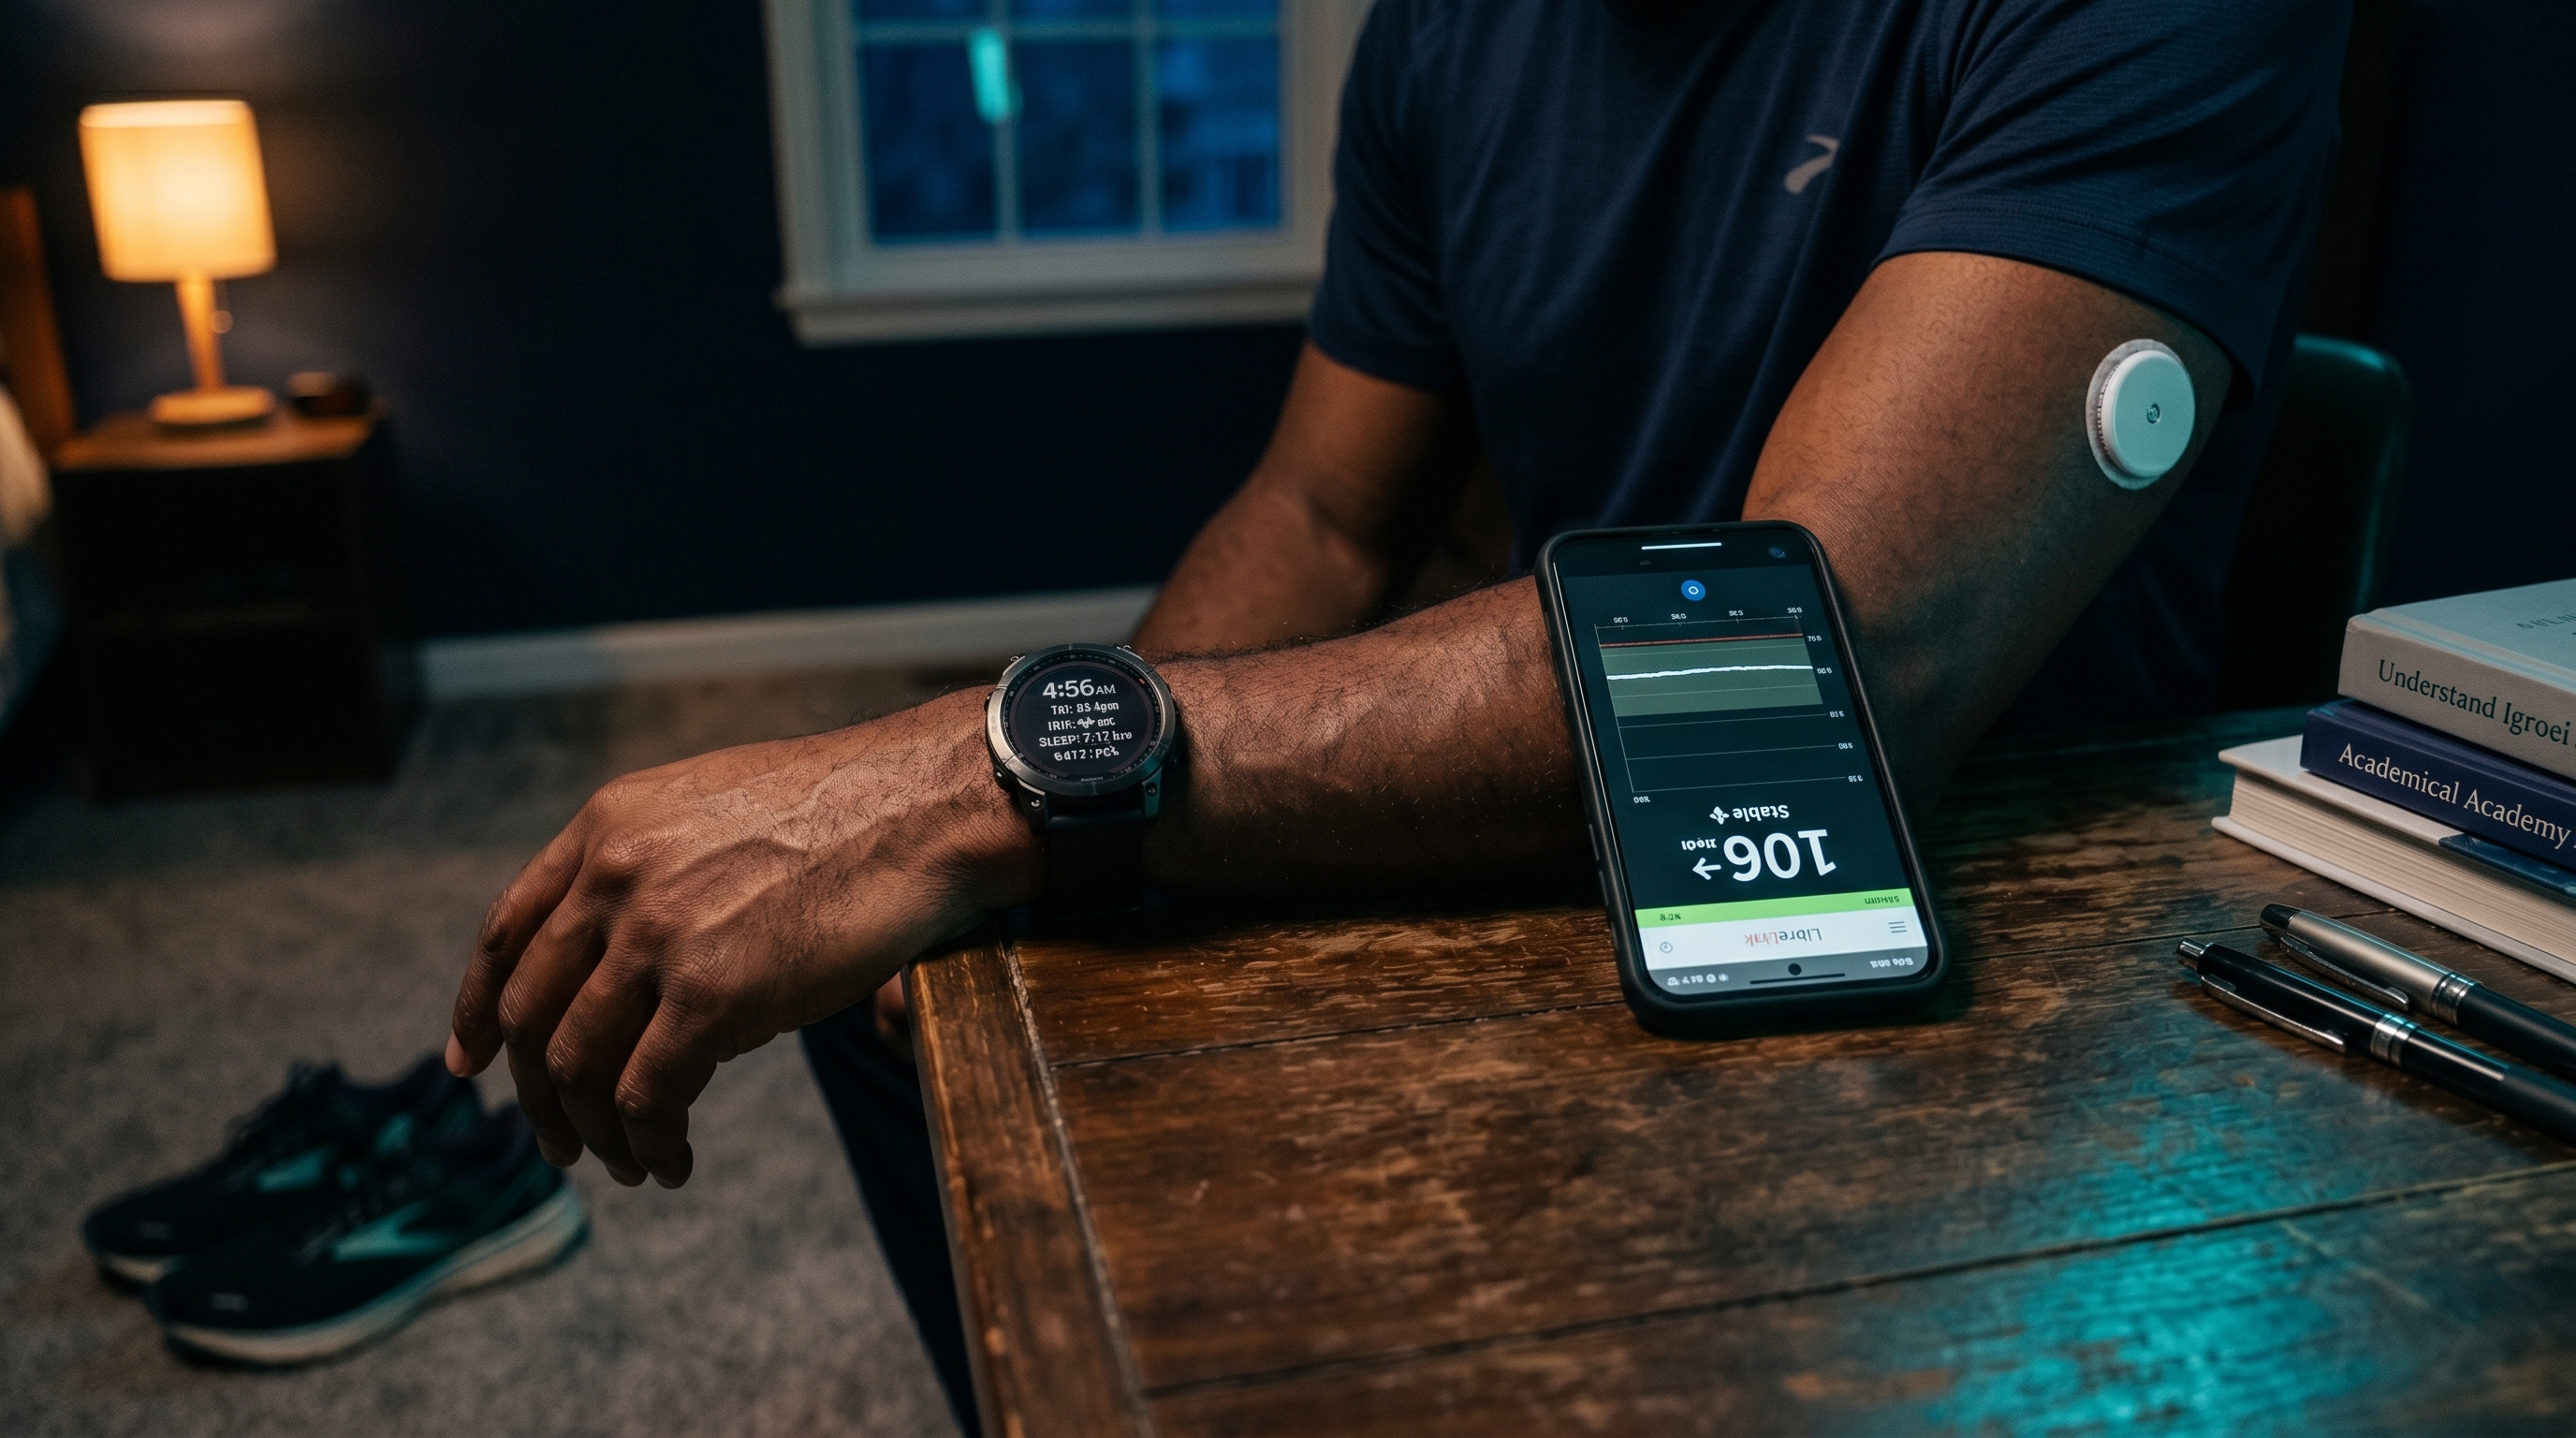
The fasting glucose was 86. The overnight CGM trace was stable. No dawn phenomenon, no rebound hyperglycemia, no variability worth noting. Body Battery read 72. Sleep was 7 hours and 4 minutes. Left ankle soreness: minimal.
Metabolically, the morning looked encouraging.
But HRV told a different story.
The autonomic nervous system was still under strain. And that gap is the central problem PGIS keeps surfacing: glycemic recovery and autonomic recovery do not move at the same speed.
That turns out to matter more than I expected when I started building this system.
What the April Drift Actually Was
I started 2026 training for a Thanksgiving half marathon. January and February were highly structured: six training days per week, Zone 2 pacing calibrated against HRV, Libre CGM data feeding daily readiness assessments, aerobic efficiency improving in measurable increments.
Then April arrived.
Clinical workload increased. Sleep quality dropped. HRV began a slow descent. Work stress accumulated the way clinical stress accumulates: not in a single large event, but in successive small ones, each manageable on its own.
I missed one workout. Then another. Then another.
Six weeks disappeared.
For most runners, that is frustrating and fixable. For a physician-developer running a biometric feedback system across glucose, autonomic function, and recovery, it becomes something else: a structural integrity test.
The question stopped being “why did I miss training.” It became: what exactly failed inside the system, and what does the data show about how to rebuild it?
What PGIS Is
PGIS stands for Performance Glycemic Intelligence System.
I introduced it in detail in From the ICU to the Marathon Course, but the short version: PGIS is my attempt to unify continuous glucose monitoring, wearable recovery metrics, exercise performance data, subjective inflammation scoring, nutrition, sleep, and narrative journaling into a single operational feedback loop.
The healthcare problem PGIS is built around is not a lack of data. We have CGMs, smartwatches, EMRs, nutrition apps, fitness trackers, and AI copilots. The problem is fragmentation. None of these systems synthesize into actionable clinical intelligence.
PGIS is my attempt to explore that synthesis at personal scale, before scaling it as clinical architecture.
The Two-Speed Recovery Gap
This morning’s check-in demonstrated something the system has been teaching me since March.
Glycemic recovery and autonomic recovery do not move at the same speed.
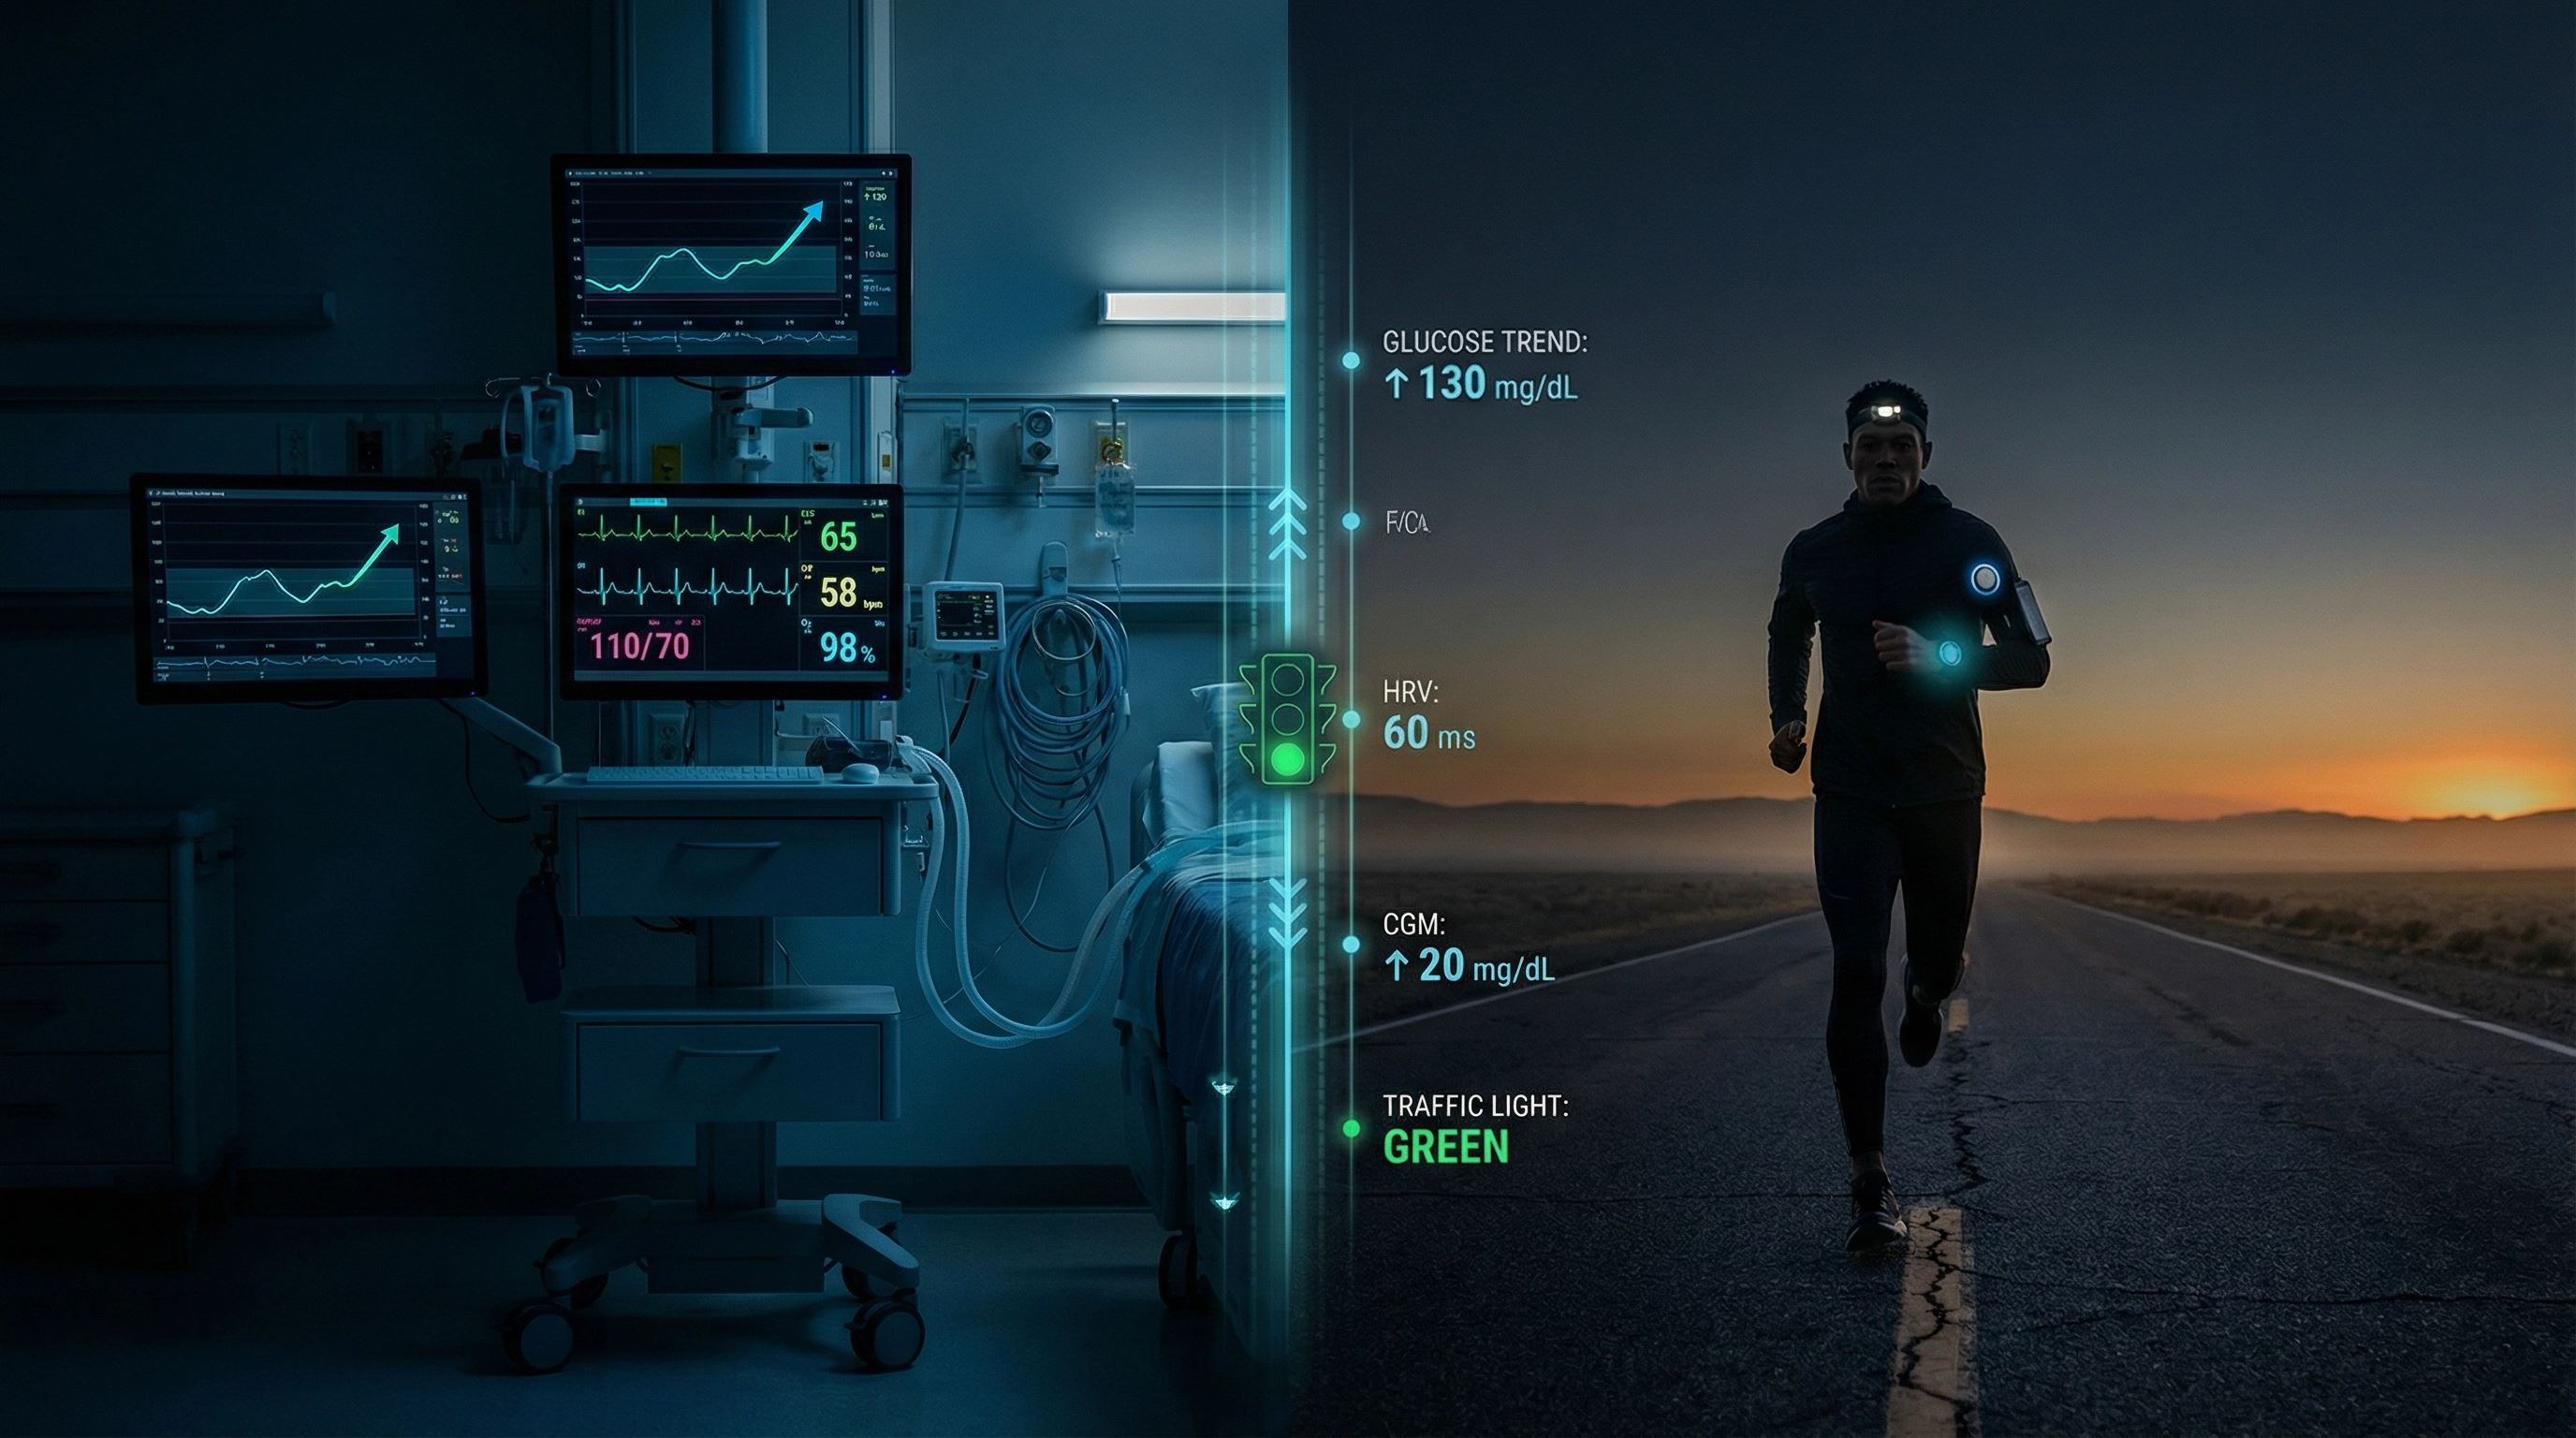
Here are this morning’s parameters:
- Fasting glucose: 86 mg/dL
- HRV: 22
- Resting heart rate: 63 bpm
- Body Battery: 72
- Sleep: 7h 4m
- Left ankle soreness: minimal
The metabolic picture was clean. For a 60-year-old physician with Type 2 diabetes completing six weeks of training disruption, a fasting glucose of 86 and a stable overnight CGM trace are not incidental findings. They are encouraging ones.
But HRV at 22 is a signal. The autonomic nervous system was still consolidating. Still processing six weeks of clinical overload, disrupted sleep, and detraining.
I call this the two-speed recovery gap.
Glycemic homeostasis can normalize relatively quickly after training disruption. Autonomic recovery takes longer, is more sensitive to accumulated psychological stress, and does not respond well to being forced.
The clinical implication is real. Many athletes, and many patients returning from illness, surgery, or physiological stress, interpret one positive biomarker as permission to reload the entire system. Glucose looks fine, so they train hard. Pain resolves, so they return to full activity. One metric clears, and they assume readiness.
That is how reinjury happens. That is how burnout begins. That is how inflammatory cascades initiate.
PGIS does not read one metric. It reads the interaction between metrics. This morning, that interaction said: move, but move carefully.
The Architecture Behind the Morning Check-In
The current PGIS workflow is intentionally low-friction.
Each morning I log fasting glucose from my Libre CGM, HRV and resting heart rate from Garmin, subjective inflammation score, sleep duration and quality, Body Battery reading, and any notable soreness or stiffness. Brief narrative observations when something warrants them.
These entries feed into a GitHub-hosted markdown log. A NotebookLM workflow extracts patterns across sessions. AI-generated summaries surface trends that daily noise would otherwise bury.
The diagnostic questions the system asks each morning are deliberately simple:
How recovered is the autonomic system? Is inflammation accumulating or resolving? Is glucose volatility rising or falling? Is training load exceeding adaptive capacity? What does today’s data suggest about tomorrow?
The complexity is not in the questions. It is in reading what their interaction reveals.
What This Looks Like at Clinical Scale
The Thanksgiving half marathon is a useful forcing function. But it is not the real project.
Imagine this framework applied to gestational diabetes management. Or cardiac rehabilitation. Or perioperative recovery monitoring in high-risk surgical patients. Or longitudinal burnout surveillance in healthcare workers.
Not generic dashboards built on population averages. Not isolated biomarkers reported in clinical silos. Integrated longitudinal intelligence that tracks the interaction between stress, metabolism, autonomic function, and recovery over time.
This is not AI replacing the physician. It is a physician-built system that makes patterns visible earlier, so clinical judgment can act sooner.
The future clinical winner will not simply have more data. The winner will have better synthesis, better signal detection, and better workflow integration. PGIS, at personal scale, is a proof of concept for that architecture.
What Failure Revealed About the Architecture
Ironically, the six-week layoff may have stress-tested PGIS more productively than uninterrupted training would have.
Consistent training confirms what is working. Disruption reveals what was fragile.
The layoff surfaced things a clean training block cannot show: how sleep debt compounds across weeks of clinical overload, how HRV responds differently to detraining versus acute psychological stress, how glucose stability can mask autonomic dysregulation, and how motivational drift interacts with physiological readiness.
Those are not failure data points. They are architecture data points.
The system is more complete for having processed them.
The New Goal
I am not trying to recover the fitness lost in six weeks. That framing is too narrow.
The actual goal is sustainable consistency, measured by the system.
The training plan that works for a physician-runner at 60 is not the one with maximum mileage, maximum intensity, or maximum suffering. It is the one that produces repeatable recovery, session after session, across a 26-week block.
This morning’s data said: run easy. Keep heart rate in Zone 2. Do not interpret the clean glucose numbers as permission to push. The autonomic system is still consolidating.
That is precise instruction. Not from a coach. From the data.
Intelligent pacing will outperform emotional pacing over a full training cycle. I have enough PGIS history now to know that.
If you are building anything in health technology, start here: instrument yourself first, across metrics that do not normally speak to each other, and observe what their interaction reveals.
The patient application is just that pattern, built for someone else.
Related articles
I Didn't Download an App. I Described My Problem to an AI and It Built One for Me.
A Maternal-Fetal Medicine specialist describes how his personal AI health system identified low HRV, recommended breathing exercises, and prompted him to build a custom evidence-based breathing app in a single afternoon. A case study in disposable software, physician agency, and the future of personal health technology.
From the ICU to the Marathon Course: What AI-Driven Glycemic Control Teaches Us About Athletic Performance
A physician-developer explores the powerful parallels between AI-driven glycemic control in the ICU and metabolic management for endurance athletes with Type 2 diabetes, introducing the Performance Glycemic Intelligence System (PGIS) as a real-world n-of-1 framework.
I Built an OpenClaw Agent to Understand What Developers Are Actually Doing (Not Because I Needed One)
Maternal-Fetal Medicine Specialist | Founder, CodeCraftMD | Atlanta Perinatal Associates

Maternal-Fetal Medicine Specialist