Python: The Language of Clinical Data
JavaScript runs in the browser. Python runs behind the workflow, where lab values, CSV exports, data cleaning, and clinical models actually live.
Listen to this post
Python: The Language of Clinical Data

On this page15 sections
I did a chart review last year for a QI project. Fifty-three patients. We needed every hemoglobin, platelet count, and creatinine drawn between twenty and twenty-eight weeks. The data was in a spreadsheet that our clinical informatics coordinator exported from the EHR.
It took me forty minutes to write the Python script. It took the spreadsheet method about three hours, and two of those hours were a colleague manually cross-checking that none of the values had shifted columns on export.
The Python script was eleven lines. The script was right. The spreadsheet had two errors.
Why Python for Clinical Work
JavaScript solves the interface problem. Python solves the data problem.
Every major statistical library in biomedical research runs on Python. pandas for data manipulation. NumPy for numerical computing. scikit-learn for machine learning. matplotlib and seaborn for visualization. SciPy for statistical tests. The CDC’s public health datasets include Python examples. PubMed abstracts increasingly cite Python for analysis. R still has a strong foothold in academic biostatistics, and it is worth knowing, but Python has become the common language of clinical data work.
The other reason Python matters for physician-developers is the backend. FastAPI, the framework we will use in a later post to build the risk model server for our Preeclampsia Risk Companion, is Python. When you need a server that runs a calculation, calls a ML model, or processes lab data before sending it to a JavaScript front end, Python is the natural choice for that server.
The two languages are not rivals. JavaScript and Python divide the work cleanly. JavaScript lives in the browser. Python lives everywhere behind it.
Why Python Reads Like Pseudocode
Python was designed to be readable. Its creator, Guido van Rossum, made indentation part of the syntax. A block of code is defined by how far it is indented, not by curly braces.
# JavaScript equivalent
function flagLowHemoglobin(value) {
  if (value < 10.0) {
    return true;
  }
  return false;
}

# Python equivalent
def flag_low_hemoglobin(value):
    if value < 10.0:
        return True
    return False
Python uses def instead of function. It uses a colon and indentation instead of braces. It uses True and False with capital letters. Everything else reads nearly the same.
For physicians who learned to write clinical notes, Python’s structure feels familiar. A function in Python reads like a short procedure note. Input at the top, logic in the middle, output at the bottom.
The Libraries That Cover Ninety Percent of Physician Use Cases
pandas
pandas is how you work with tabular data in Python. Think of a pandas DataFrame as a spreadsheet that your code can manipulate programmatically.
import pandas as pd

# Load a CSV file
df = pd.read_csv("prenatal_labs.csv")

# Look at the first five rows
print(df.head())

# Filter to rows where hemoglobin is below the threshold
low_hgb = df[df["hemoglobin_g_dl"] < 10.0]

# Count how many
print(f"Patients with Hgb < 10: {len(low_hgb)}")
The df[df["column"] < value] pattern is the pandas filter. It reads as: “give me every row of this DataFrame where this column meets this condition.” You will use this pattern constantly.
NumPy
NumPy provides numerical operations on arrays. pandas is built on top of it. Most of the time you will use pandas and NumPy will be working in the background. When you need to do something mathematically precise with a large array of values, NumPy is what you reach for.
import numpy as np

values = np.array([10.2, 8.9, 11.4, 9.1, 12.3])
print(f"Mean: {np.mean(values):.1f}")
print(f"Std Dev: {np.std(values):.1f}")
scikit-learn
scikit-learn is the standard Python library for machine learning. Logistic regression, decision trees, random forests, support vector machines. All of them follow the same pattern: create a model, fit it to training data, use it to predict on new data.
We will not build a machine learning model in this post. That is a topic for a future series. But you should know scikit-learn exists and what it does, because the risk model we eventually add to the Preeclampsia Risk Companion will use it.
FastAPI
FastAPI is the Python web framework we will use for the backend of the Risk Companion. It lets you build a REST API quickly and with good defaults.
from fastapi import FastAPI

app = FastAPI()

@app.get("/risk")
def calculate_risk(high_count: int, moderate_count: int):
    if high_count >= 1:
        return {"tier": "high", "aspirin_recommended": True}
    if moderate_count >= 2:
        return {"tier": "moderate", "aspirin_recommended": True}
    return {"tier": "low", "aspirin_recommended": False}
We will build this out properly in Post 11 when we add the backend layer to the Risk Companion. For now, know that FastAPI turns a Python function into an HTTP endpoint with almost no boilerplate.
Package Management: pip and uv
Python’s package manager is pip. You install libraries with it:
pip install pandas
pip install numpy
pip install scikit-learn
pip install fastapi
In 2026, many Python developers have switched to uv, a faster replacement for pip written in Rust. It manages both packages and Python versions, and it is dramatically faster than pip on large projects.
# Install uv
curl -LsSf https://astral.sh/uv/install.sh | sh

# Create a project
uv init my-clinical-project
cd my-clinical-project

# Add a package
uv add pandas
For this post, either pip or uv works. If you are starting fresh, use uv. If you already have pip configured and working, stay there.
Hands-On: Lab Outlier Flagging for Prenatal Chart Review
This script takes a de-identified CSV of prenatal lab values and flags results outside clinical thresholds. It is the kind of analysis that takes three hours manually and eleven minutes with Python.
The Sample Data
First, create a file called prenatal_labs.csv with this content:
patient_id,ga_weeks,hemoglobin_g_dl,platelets_k_ul,creatinine_mg_dl,ast_u_l,alt_u_l
P001,22,11.2,245,0.7,22,18
P002,24,9.4,198,0.8,25,20
P003,26,10.8,87,0.6,31,24
P004,28,8.1,312,1.3,45,38
P005,20,12.1,401,0.7,19,15
P006,22,11.9,156,0.8,28,22
P007,24,7.8,95,0.9,62,54
P008,26,10.2,224,0.7,24,19
P009,28,9.8,178,1.1,33,29
P010,20,11.5,267,0.8,21,17
This is completely de-identified. No names, no dates, no identifiers beyond an arbitrary patient ID.
The Script
Create lab_outliers.py:
# lab_outliers.py
# Flags prenatal lab values outside standard clinical thresholds.
# Input:  prenatal_labs.csv (de-identified)
# Output: console summary + flagged_results.csv

import pandas as pd

# --- Thresholds ---
# Based on standard obstetric reference ranges.
# Adjust these for your institutional norms.
THRESHOLDS = {
    "hemoglobin_g_dl":  {"low": 10.0,  "high": None},
    "platelets_k_ul":   {"low": 100.0, "high": None},
    "creatinine_mg_dl": {"low": None,  "high": 1.0},
    "ast_u_l":          {"low": None,  "high": 40.0},
    "alt_u_l":          {"low": None,  "high": 40.0},
}

CLINICAL_LABELS = {
    "hemoglobin_g_dl":  "Hemoglobin (g/dL)",
    "platelets_k_ul":   "Platelets (K/uL)",
    "creatinine_mg_dl": "Creatinine (mg/dL)",
    "ast_u_l":          "AST (U/L)",
    "alt_u_l":          "ALT (U/L)",
}


def flag_row(row: pd.Series) -> list[str]:
    """Return a list of concern strings for a single patient row."""
    concerns = []

    for column, limits in THRESHOLDS.items():
        value = row[column]

        if pd.isna(value):
            continue

        low = limits["low"]
        high = limits["high"]
        label = CLINICAL_LABELS[column]

        if low is not None and value < low:
            concerns.append(f"{label} LOW ({value})")
        if high is not None and value > high:
            concerns.append(f"{label} HIGH ({value})")

    return concerns


def main():
    df = pd.read_csv("prenatal_labs.csv")

    print(f"Loaded {len(df)} patient records.\n")
    print(f"{'Patient':<12} {'GA (wk)':<10} {'Concerns'}")
    print("-" * 70)

    flagged_rows = []

    for _, row in df.iterrows():
        concerns = flag_row(row)

        status = ", ".join(concerns) if concerns else "Within range"
        print(f"{row['patient_id']:<12} {row['ga_weeks']:<10} {status}")

        if concerns:
            flagged_rows.append({
                "patient_id": row["patient_id"],
                "ga_weeks": row["ga_weeks"],
                "concerns": "; ".join(concerns),
            })

    print("-" * 70)
    print(f"\n{len(flagged_rows)} of {len(df)} patients have flagged values.\n")

    if flagged_rows:
        flagged_df = pd.DataFrame(flagged_rows)
        flagged_df.to_csv("flagged_results.csv", index=False)
        print("Flagged results written to flagged_results.csv")


if __name__ == "__main__":
    main()
Run it:
python lab_outliers.pyThe output:
Loaded 10 patient records.

Patient      GA (wk)    Concerns
----------------------------------------------------------------------
P001         22         Within range
P002         24         Hemoglobin (g/dL) LOW (9.4)
P003         26         Platelets (K/uL) LOW (87)
P004         28         Hemoglobin (g/dL) LOW (8.1), Creatinine (mg/dL) HIGH (1.3)
P005         20         Within range
P006         22         Within range
P007         24         Hemoglobin (g/dL) LOW (7.8), Platelets (K/uL) LOW (95), AST (U/L) HIGH (62), ALT (U/L) HIGH (54)
P008         26         Within range
P009         28         Creatinine (mg/dL) HIGH (1.1)
P010         20         Within range
----------------------------------------------------------------------

6 of 10 patients have flagged values.

Flagged results written to flagged_results.csv
P007 at twenty-four weeks has four abnormal values: anemia, thrombocytopenia, and elevated liver enzymes. That pattern warrants immediate clinical attention. The script found it in under a second.
What the Code Is Doing
The THRESHOLDS dictionary is the clinical decision layer. Changing a threshold is one line. The logic that evaluates the thresholds is separate from the thresholds themselves. This is the same separation-of-concerns pattern we introduced in Post 2.
THRESHOLDS = {
    "hemoglobin_g_dl": {"low": 10.0, "high": None},
    ...
}
The flag_row function takes a single row and returns a list of concern strings. It knows nothing about the DataFrame, the file, or the output format. It is a pure function: input in, output out. Testable in isolation.
The main function does the orchestration: load the data, iterate over rows, call flag_row, print results, write output.
for _, row in df.iterrows():
    concerns = flag_row(row)
df.iterrows() gives you each row as a pandas Series. The _ is a convention for “I am not using this value” — in this case, the row index.
Extending This
Adding a new lab is four lines: one entry in THRESHOLDS and one in CLINICAL_LABELS. The logic requires no changes.
Adding a gestational-age-specific threshold — flagging creatinine above 0.8 in the third trimester rather than 1.0 — means modifying flag_row to check row["ga_weeks"] before applying the limit. The structure supports it without a rewrite.
What Can Go Wrong
ModuleNotFoundError: No module named 'pandas'. You have not installed pandas in your current environment, or you are in the wrong virtual environment. Run pip install pandas or uv add pandas in the same terminal session where you run the script.
FileNotFoundError: prenatal_labs.csv. Python looks for the file relative to where you run the script, not where the script file lives. Make sure your terminal is in the same folder as the CSV, or provide an absolute path to pd.read_csv().
Columns load but the values are strings, not numbers. pandas infers column types on load. If a column contains a stray character in any cell (a space, a unit like “g/dL” embedded in the value, a note field), the entire column loads as strings. Check with df.dtypes and clean the offending column with pd.to_numeric(df["column"], errors="coerce").
The script runs but flags nothing unexpected. Add print(df.dtypes) after loading and verify the numeric columns are float64 or int64, not object. If they are object, see the previous point.
Closing
The chart review that took three hours with a spreadsheet took forty minutes with Python — and thirty of those were writing the script for the first time.
The second chart review will take two minutes. The script already exists.
This is the compounding return on learning Python. Each script you write either solves the immediate problem or becomes the template for the next one. The thresholds change. The patient population changes. The column names in the export change. The logic does not.
JavaScript gave us the interface. TypeScript made it safe. Python gives us access to the data behind both.
In Post 4, we introduce the tool that changes how you write all three: AI-assisted coding.
Related articles
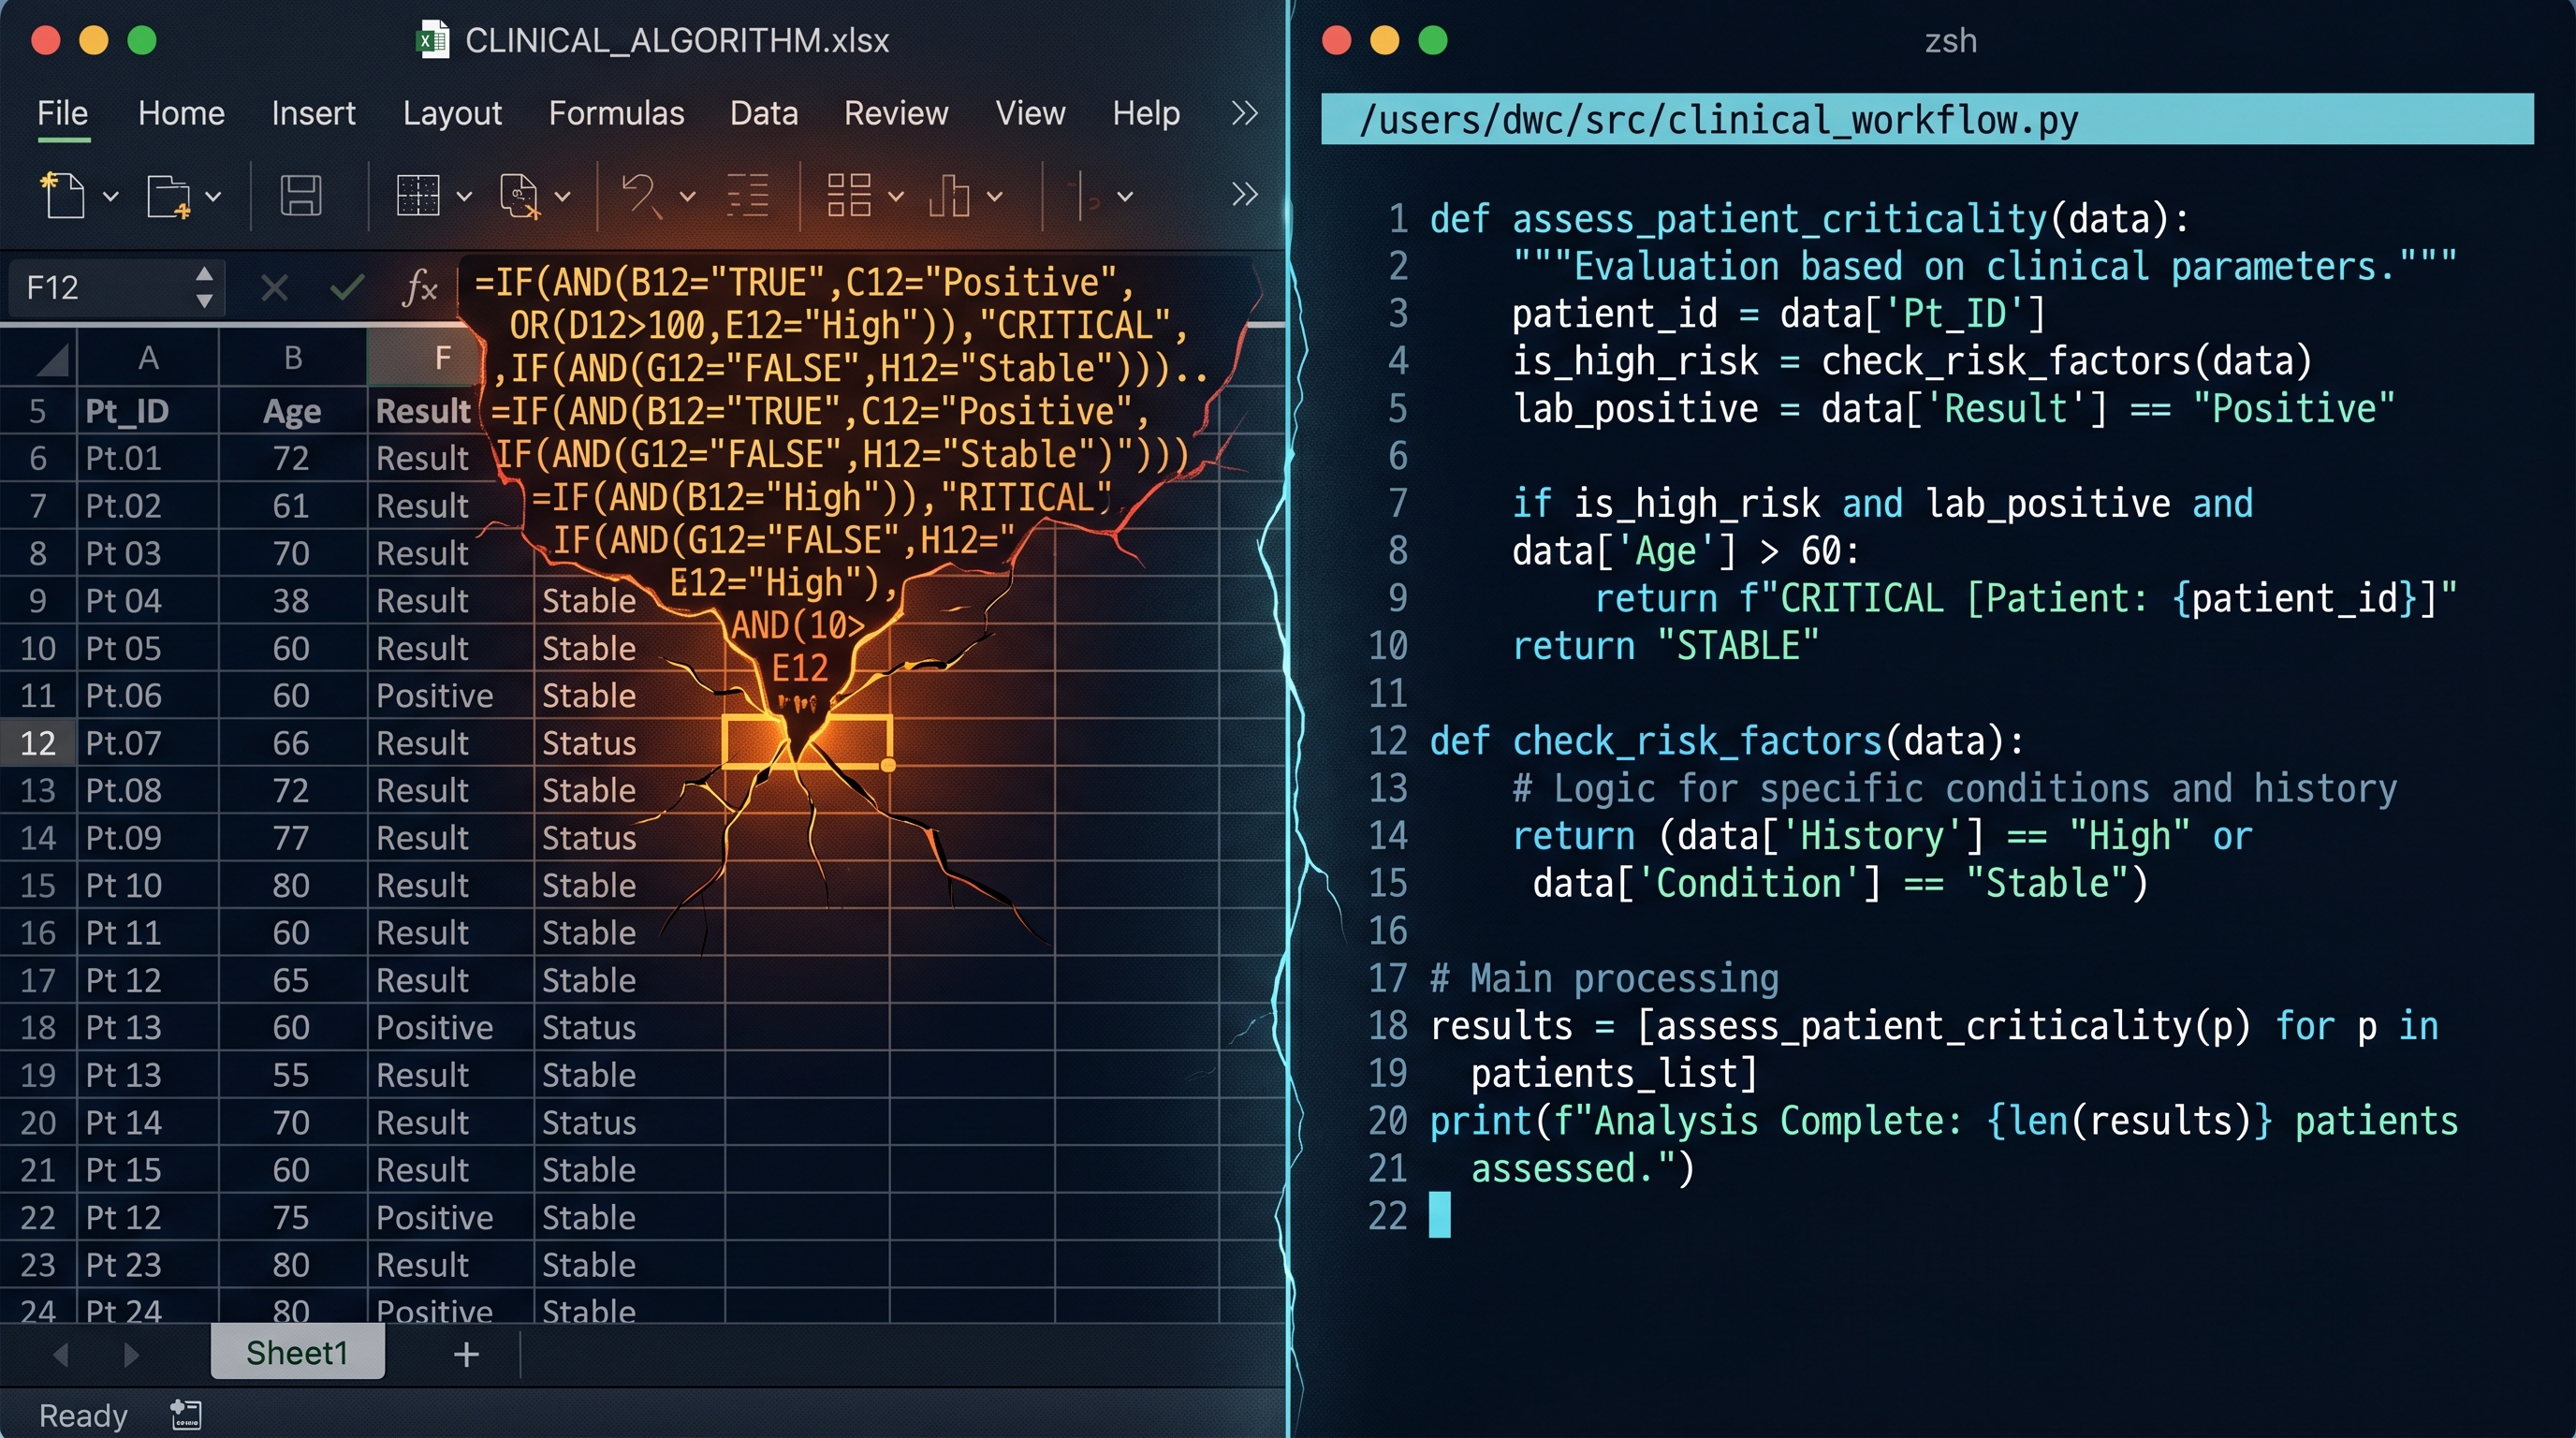
From Excel to Python: When Your Spreadsheet Becomes a Liability
Excel is often the right first move for a physician-builder. The problem begins when clinical logic stays trapped in a container that can no longer safely hold it.

The Moment a Clinical Tool Becomes Infrastructure
A short introduction to a DoctorsWhoCode series on spreadsheets, tests, and retrieval as the basic discipline of physician-built clinical software.

The Protocol-to-Website Industrial Complex:
By Dr. Chukwuma Onyeije, MD, FACOG | Maternal-Fetal Medicine Specialist & Medical Director, Atlanta Perinatal Associates

Maternal-Fetal Medicine Specialist